The data-driven approach to business is becoming more popular than ever. The insights that we can now gain from analytic software can shape entire business strategies. And, decision makers have access to more data than ever before to help guide their actions to build better business applications.

Content Analytics 101: How to Evaluate The Performance of Your Content Interaction
This is good news for content creators and planners. With content analytics, we can get real-time insights into customer interactions and content engagement. We can use this information to help optimize our content and scheduling.

Free to use image sourced from pixabay.com
What is content analytics?
If you work in marketing or content creation, then you’re probably already aware of performance tracking. Monitoring the SEO rankings of your content, for example, is nothing new. Content analysis is similar but with the addition of business intelligence tools.
Using modern data analytics, content analysis gives a more granular breakdown of content performance. This could be any of your content, your landing page, blog posts, social media marketing, and so on.
Content analytics is about using the assistance of technology to analyze large sets of unstructured data. No amount of data analyst training can give the same results that an AI-assisted program can for this kind of data sorting.
Content analytics lets you assess your competitors’ performance, too. Analyzing SERP rankings and keywords for competitor content can give you useful insight into keywords to target and more.

Why do I need to analyze my content?
You might be wondering why you need a more in-depth analysis of your content. You know your industry and you already have a content plan in place, so why change? Customer behaviors can change quickly. Regularly analyzing your analytics gives you the agility to respond just as fast.
Trend extraction
Content analytic tools are excellent at extracting trends from large datasets. For content performance, this can give you insight into your audience’s preferences. You can then focus your efforts on content types that they respond to best.
Optimization
Proper data analysis gives you all the help you need to optimize your content. Looking at traffic volumes, conversion rates, and SEO scores, you can effectively rank your content. Depending on the metrics you want to focus on, you can identify the best and worst performing content.
This lets you analyze what works from your best-performing material. Then, you can use these insights to optimize or refresh content that isn’t doing as well. You then have the opportunity to implement new content creation standards and update your process library.
Identify opportunities & threats
Looking at your competitors’ content performance is something that content managers shouldn’t ignore. Identifying keyword areas where competitors rank well, and where they don’t, lets you optimize your keyword targeting.
Assess your competition's SEO performance against your own. This will give you a clear picture of where your content is positioned in the wider market. You can think of this as a SWOT analysis, like so.
- Strengths - What are you and your competitors’ content strengths?
- Weaknesses - What are your weaker areas, and where do your rivals struggle?
- Opportunities - What new & existing topics/content hold opportunities?
- Threats - What are the threats to your strongest content?
To get an accurate analysis, you need to use the data from your content analytics. To do that, you’ll need to know the key metrics to monitor for tracking your content performance.
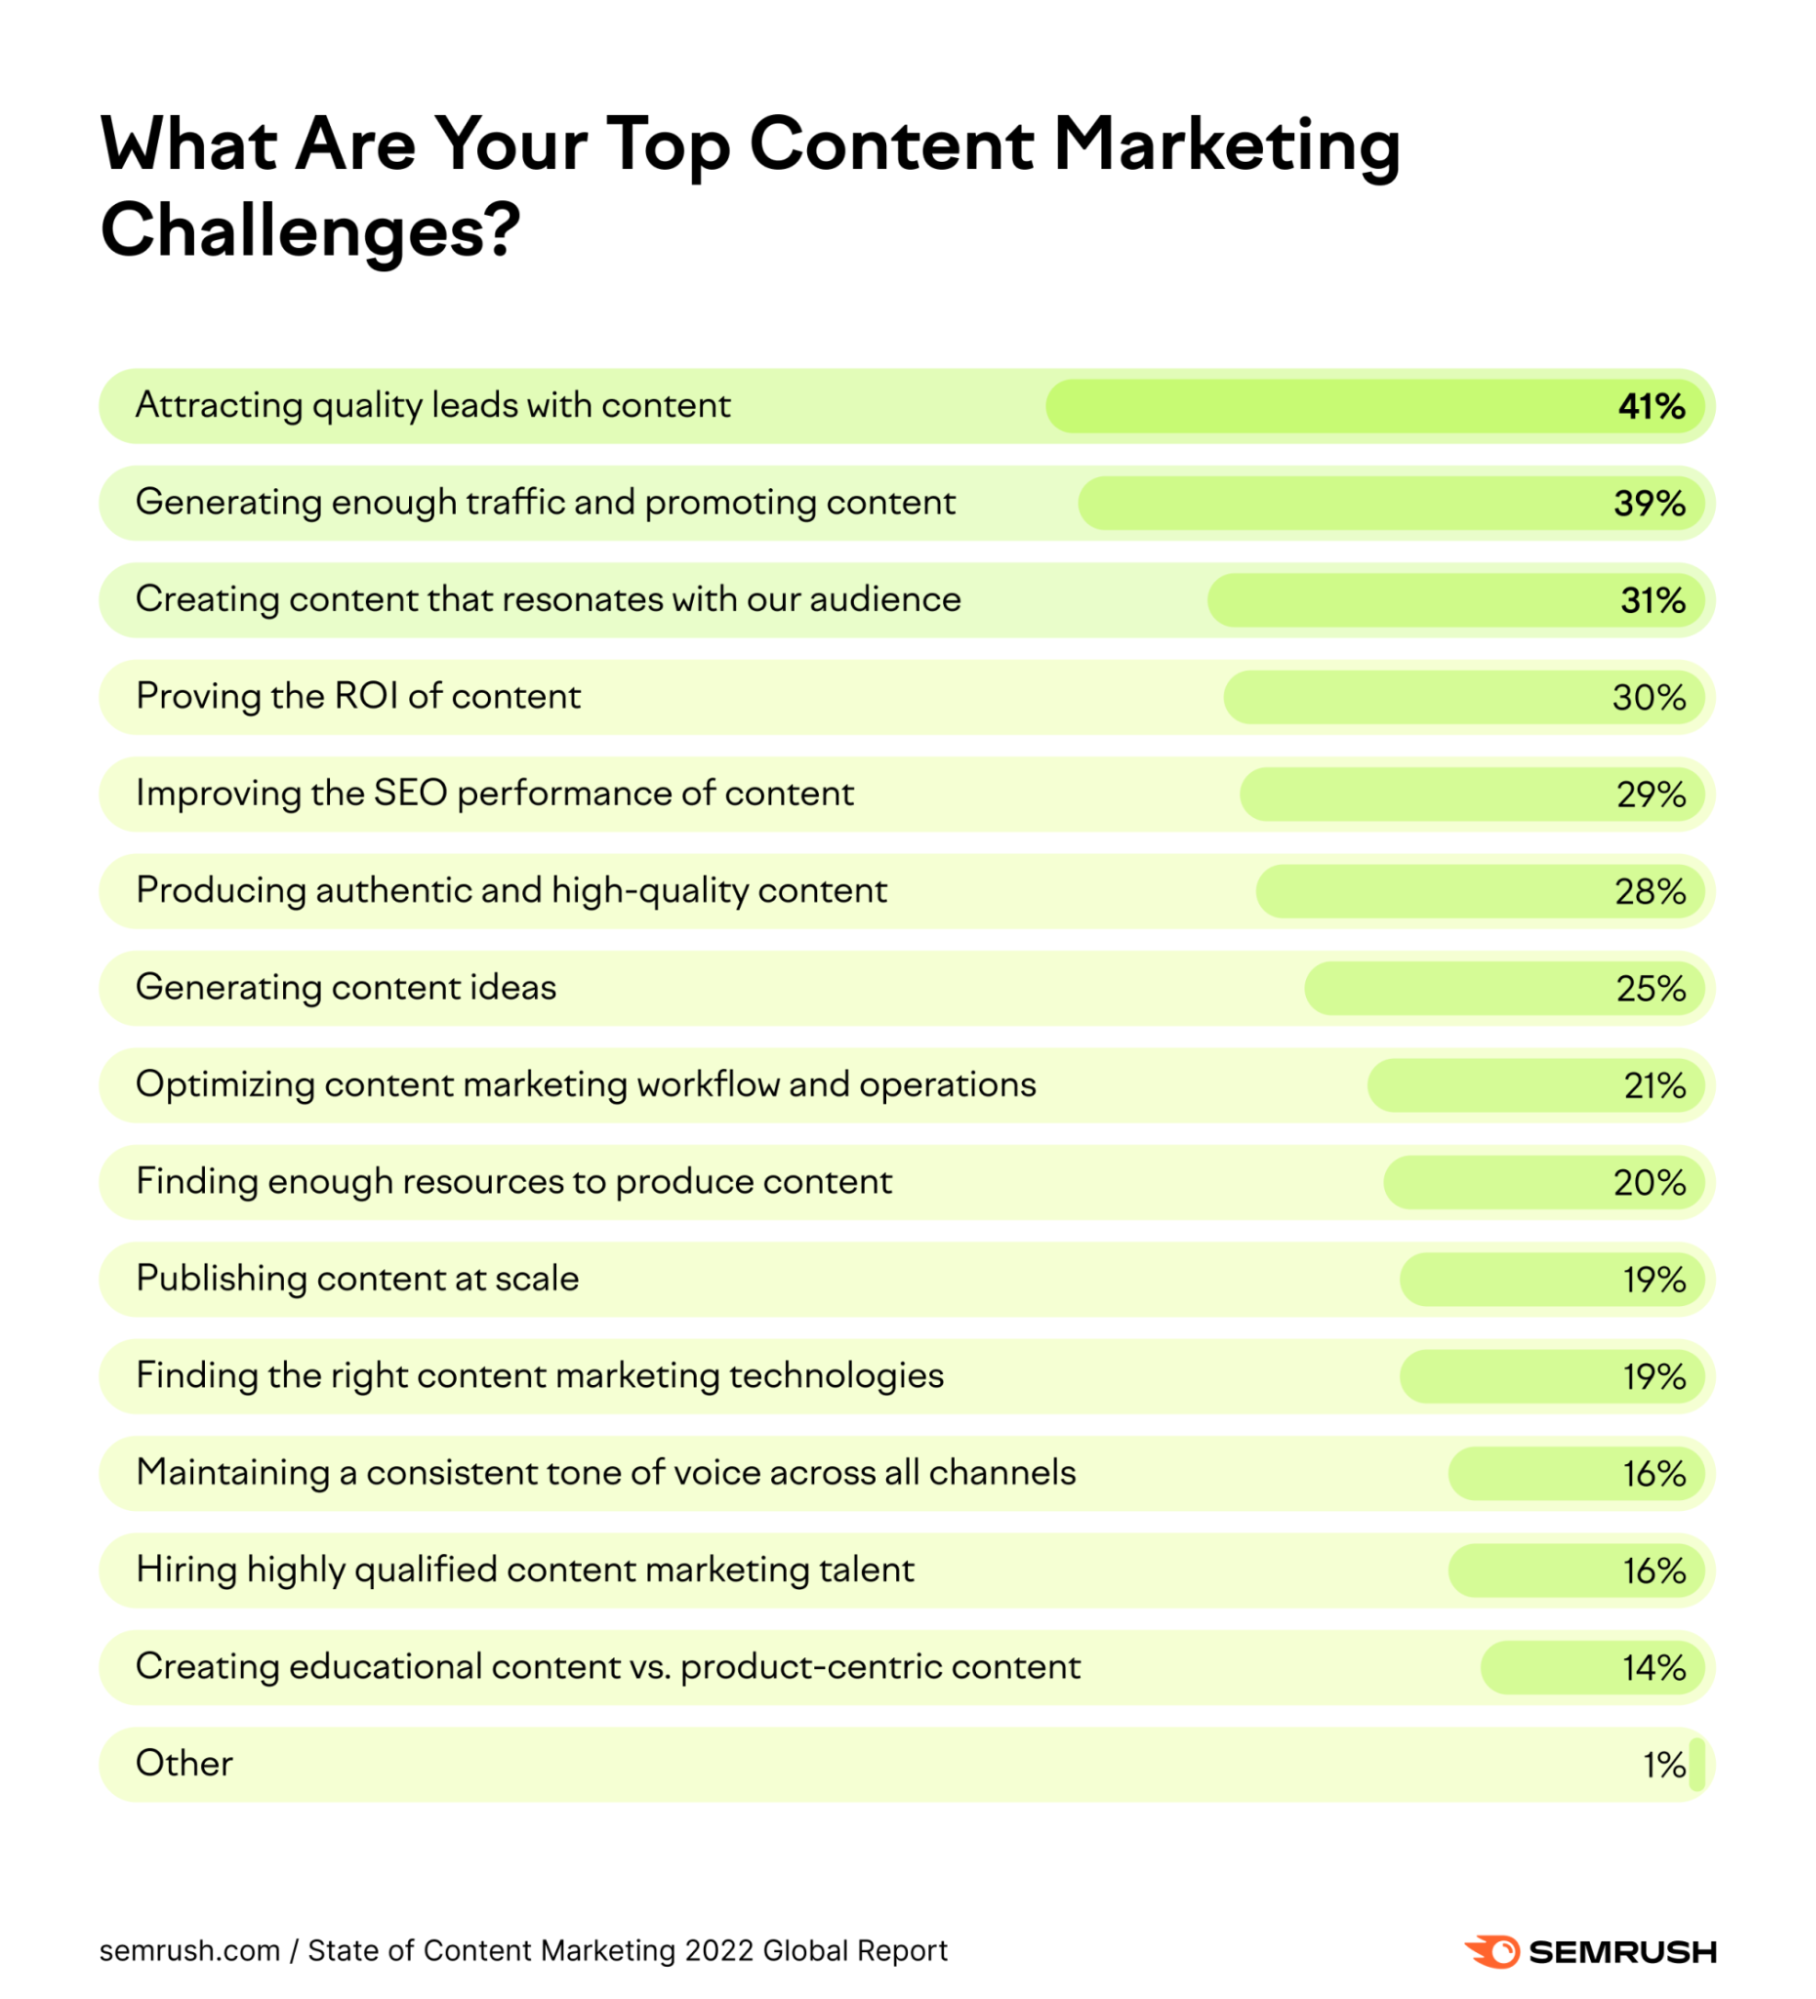
Image sourced from semrush.com
Key metrics for content analytics
The key performance indicators for content fall into four categories. In each category, there are a number of different metrics you can monitor. The most important metrics for your business will depend on what aspects of your content you want to optimize.
Engagement metrics
These metrics cover the volume of traffic interacting with your content and how they view it. This includes unique visitor numbers, time on page, time on site, bounce rates, and so on. This can tell you both the number of eyes on your content and whether it resonates with that audience.
Sharing metrics
These are social metrics such as the number of times a post is liked or shared. For social media channels, you can analyze this with in-app tools. Backlinks to your content and website shares are also a part of this category.
These metrics can lead to insights into how relevant your content is. Highly relevant content will be shared widely, which is a great way of generating organic traffic without increasing advertising costs.
Sales & lead metrics
Assessing content based on conversions and lead generations will help you demonstrate the ROI of your content. Return on investment can be difficult to quantify when it comes to content creation and the creative process.
Looking at individual conversion rates from your marketing content is simple. Yet, if you run a blog with a whole calendar of content then you need to look at the bigger picture. Looking at metrics like overall sales can help identify how long-term content plans are progressing.
Retention metrics
These metrics show how you retain customers over time and how much repeat business you get. That means numbers like customer lifetime value, repeat site visit numbers, and remarketing conversions.
To accurately monitor retention requires good customer data management. Many businesses have adopted CRM systems to manage, organize, and retrieve customer data. This allows for centralized data storage and enables the extraction of this valuable retention data.

Free to use image sourced from Unsplash
How to perform content analysis
Now you know the metrics you need to track, let’s talk about the areas you’ll want to focus on for content analysis. These four steps will help you to analyze your content from production all the way through your content cycle.
Monitor content output
Start at the beginning, with the creation and scheduling of your content. You need enough content to fill your content calendar, but you want to avoid repetitive topics. You can use a social media scheduler to help you organize your content. At the same time, you need to monitor the content types that your audience prefers.
You can help plan your content output by using your buyer personas as a starting point. If you organize content by what appeals to specific key personas, you can balance your content to cater to your whole audience.
The specific stats to track will depend on your business. You can look at output by content type, output by author, etc. the important thing is to maintain a balance of engaging content. Analyzing output statistics is a helpful guide for this balancing act.
Measure engagement by content
You need to know how your audience reacts to your content to improve it. Audience behavior tracking is one way to get a data-first impression of how your users feel about your content. This means more than just the number of views content gets.
You also need to look at whether users take other actions through the content. Do they click through links, share social media posts, comment on blog posts, and so on? Direct feedback from your audience can also make up part of this analysis.
When you analyze this kind of audience data, you can visualize trends in content preferences. This helps you optimize your content output based on what your audience engages with. In turn, this will help you reduce lead time on the creation of new content.
Identify the top & bottom performers
Analyze your best and worst performing content from a revenue perspective. You need these kinds of hard numbers to back up more subjective engagement data. This means looking at click-through rates, conversion rates, and lead generation.
You don’t necessarily need to just focus on the best performers based on this data. Supporting content can have a less direct role in driving sales, without generating much revenue itself. That’s why it’s best used alongside your engagement data.
For example, your video tutorials might not generate many sales themselves. Yet, the customer engagement from those videos is high. That means they’re helping boost retention and customer satisfaction.
They’re not directly upping your marketing numbers, but they’re keeping customers coming back. Looking at this alongside the best financial performers can help you balance your content. As well as guiding you on how to interlink your content for the best performance.
Score & rank content
Content scoring is a relatively new, data-driven method of ranking content. It lets you assess the impact of multiple pieces of content together, based on whether conversions happen after multiple interactions with a customer.
If that sounds complicated, allow us to simplify it. Let’s say a customer is interested in your business and they interact with your content four different times before converting.
They become aware of your company and want to interact more from the first post (or video, etc.). The second and third interactions might be seeking more information, or just not convincing enough to convert. The fourth blog post, ad, or social media link led to a sale.
Content analytics tools can look at the impact of every interaction and assign it a score. This is based on how impactful the content is. In the example above, the first and last interactions are very important, the second and third aren’t as important but they are contributory.
Content planning is a balancing act between content that will engage, inform, and convert. Content analytics is useful for this kind of content visualization. Looking at these scores across thousands of customer interactions can give you real insight into how your content synergizes.
Author
Pohan Lin - Senior Web Marketing and Localizations Manager #1:
Pohan Lin is the Senior Web Marketing and Localizations Manager at Databricks, a global Data and AI provider connecting the Azure data lake features and data warehouses to create lakehouse architecture. With over 18 years of experience in web marketing, online SaaS business, and ecommerce growth. Pohan is passionate about innovation and is dedicated to communicating the significant impact data has in marketing. Pohan Lin also published articles for domains such as SME-News.