A Key Performance Indicator (KPI) is a quantifiable metric used to evaluate the success of an organization or team in reaching specific performance goals. The keyword there is specific. A KPI isn’t just any number you can pull from a dashboard, it’s a number tied to an outcome you are actively trying to move.

Practical KPI Examples for Every Team: What to Track and Why It Matters
Most conversations about KPIs get stuck in theory: Choose metrics that tie to goals. Make sure they’re actionable. Keep the list short. All good advice, but at some point, you need to see actual KPI examples to understand what that looks like in practice.
This post does exactly that. Below are practical KPI examples organized by team type, along with notes on what makes each one worth tracking.
Quick Summary: KPIs vs. Metrics
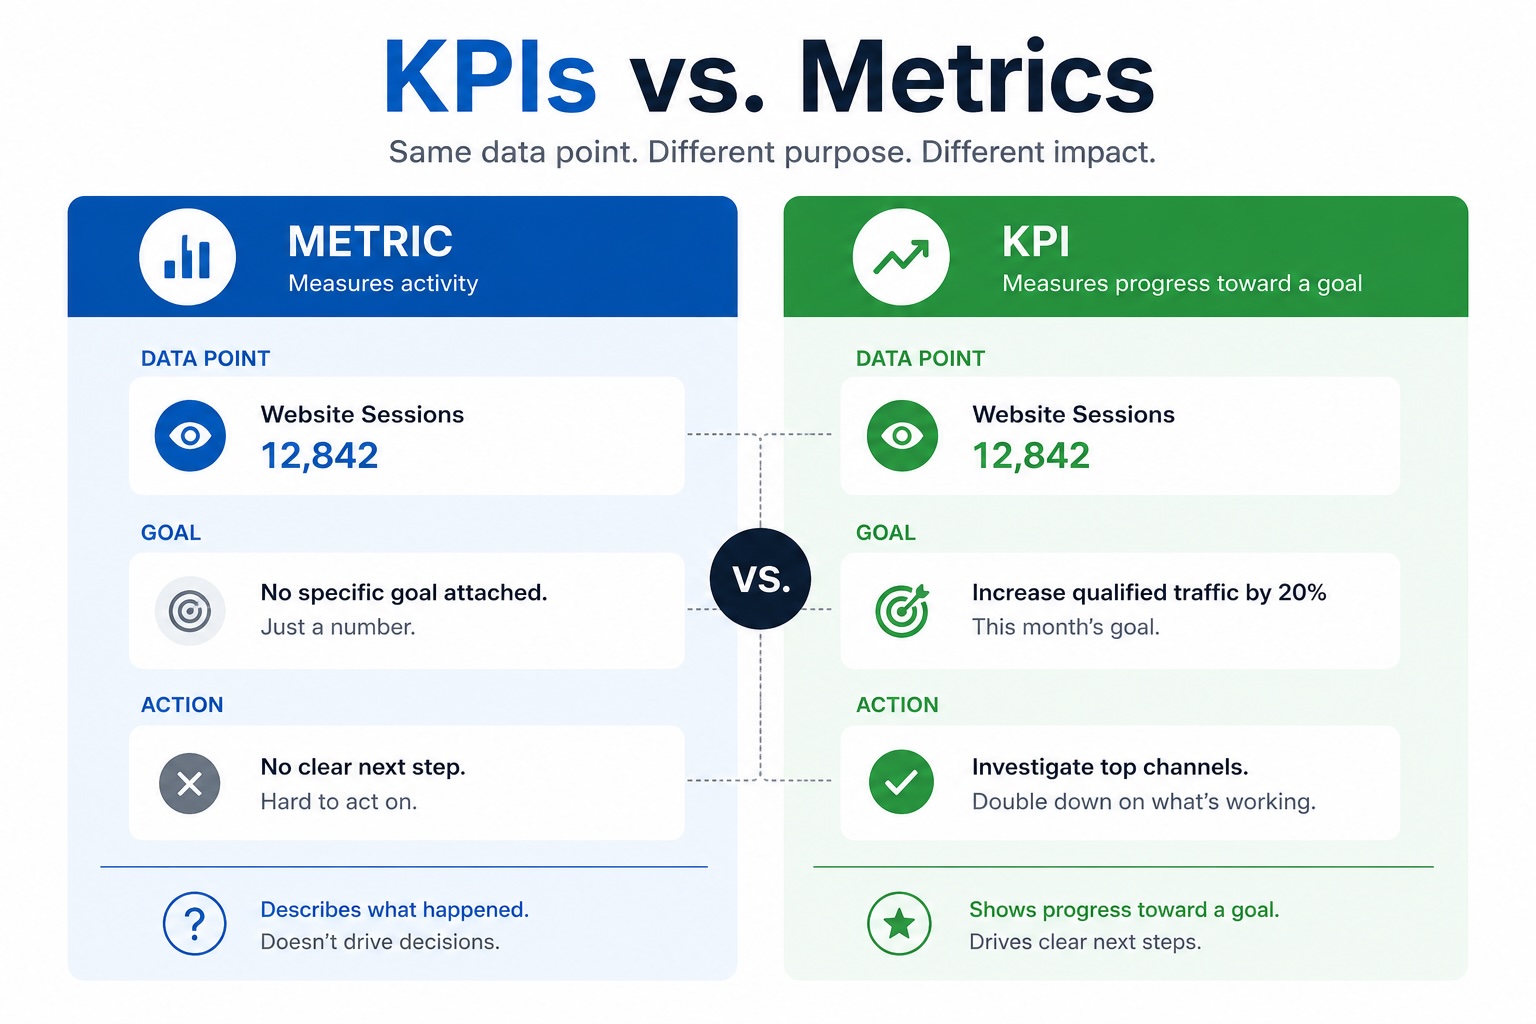
This trips people up constantly, so let’s clear it up: All KPIs are metrics, but not all metrics are KPIs.
| Data Type | Definition | The Litmus Test | Example |
|---|---|---|---|
| Metric | Any data point you can measure. | If this number changes, you might just say "Huh, interesting" and move on. | Page views, login count, emails sent. |
| KPI | A metric elevated because it directly tracks a critical business goal. | If this number changes, your team has a clear, immediate response (investigate, escalate, adjust). | Pipeline conversion rate, customer churn. |
Jump to the section most relevant to you:
- What Makes a Good KPI Example
- KPIs vs. Metrics: What's the Difference
- Marketing KPI Examples
- HR KPI Examples
- Project Management KPI Examples
- IT and Security KPI Examples
What Makes a Good KPI Example
Before diving into the lists, keep this filter in mind. A strong KPI does three things:
- It connects to a specific goal.
- It changes in response to actions your team can take.
- It tells you what to do next when the number moves.
Not every example below will be right for your situation. The goal is to give you a starting point, not a rigid checklist.
When there's no clear goal, KPIs become noise. This is especially true for public sector sites — if you're managing a government website, choosing the right KPIs looks a little different.
Marketing KPI Examples
Marketing teams often track too much data—traffic, impressions, follower counts. These are vanity metrics; they look nice in a slide deck but rarely drive decisions. Strong marketing KPIs are tied to pipeline, not just visibility.
1. Marketing Conversion Rate by Channel
- What it is: The percentage of visitors from each traffic source (organic, paid, social) who complete a desired action (e.g., filling out a form, requesting a demo).
- Why it matters: It tells you which channels are driving actual business value, preventing you from wasting budget on high-traffic, low-intent sources.
2. Cost Per Lead (CPL)
- What it is: Total marketing spend divided by the number of qualified leads generated.
- Why it matters: It measures budget efficiency. If your CPL spikes, it’s an immediate signal to optimize your ad targeting or landing pages.
3. Content Engagement Rate
- What it is: A combined metric of time-on-page and scroll depth for content pieces.
- Why it matters: High traffic means nothing if users bounce after the first paragraph. Low engagement signals that your content isn't delivering on the headline's promise.
Want to see how a better CMS affects your KPIs? A platform that makes publishing fast and workflows simple has a direct impact on the metrics that matter. Start a free trial of Concrete CMS and see for yourself.
- What it is: The percentage of total website visitors who request a product experience.
- Why it matters: This is the ultimate bottom-of-funnel marketing metric. Everything else your marketing team does feeds into this number.
HR & Internal Communications KPI Examples
HR teams managing intranets and internal resource hubs face a unique challenge: their users aren't external customers, making outcomes harder to quantify. Look to these metrics to measure internal success:
5. HR Self-Service Rate
- What it is: The percentage of common HR requests handled via the intranet vs. direct emails or direct messages.
- Why it matters: A low self-service rate means your HR team is bogged down answering repetitive questions because your internal content or navigation is failing.
6. Key Resource Adoption Rate
- What it is: Unique page views and download rates on critical documents (like a new benefits guide or compliance policy).
- Why it matters: If a critical company-wide update has only been viewed by 10% of the staff after a month, your internal distribution strategy needs immediate adjustment.
7. Time to Complete Onboarding Tasks
- What it is: The average number of days it takes a new hire to complete their digital onboarding sequence.
- Why it matters: Faster completion correlates with a better-organized resource hub and a faster time-to-productivity for new employees.
8. Intranet Employee Satisfaction (eSat)
- What it is: A simple, recurring micro-survey asking employees: "Could you easily find what you needed today?"
- Why it matters: Qualitative data catches what pure traffic numbers miss. It highlights exactly where user frustration lies. For a deeper look at what to measure, read our comprehensive guide on intranet adoption and engagement metrics.
Project Management KPI Examples
Project management KPIs should focus on delivery health: are things getting done on time, within scope, and without burning out the team? The best PM metrics are leading indicators, not post-mortems.
9. Project On-Time Delivery Rate
- What it is: The percentage of project milestones or tasks completed by their original due date.
- Why it matters: Tracked over time, this tells you whether your project scoping and planning are realistic or consistently over-optimistic.
10. Task Cycle Time
- What it is: The average time it takes to move a single task from "In Progress" to "Done."
- Why it matters: Shorter cycle times indicate fewer operational bottlenecks and less bloated "work in flight."
11. Workflow Rework Rate
- What it is: The frequency at which completed tasks are sent back for revisions or bug fixes.
- Why it matters: A high rework rate points to a systemic issue: unclear requirements, rushed handoffs, or misaligned approval processes.
12. Time to Publish
- What it is: For content and digital teams, the time it takes to move approved copy into a live production environment.
- Why it matters: If getting an approved message live takes days due to clunky technology, it reveals a workflow problem that stifles agility.
IT and Security KPI Examples
IT and compliance teams are often the last to get asked about KPIs, but the first to get blamed when something goes wrong. These metrics help move IT from a reactive firefighting mode to a proactive security stance:
13. Security Patch Latency
- What it is: The average time it takes to deploy critical security patches after a vulnerability fix is released.
- Why it matters: This is a core security metric. Minimizing patch latency narrows the window of opportunity for attackers to exploit your systems.
14. Uptime and System Availability
- What it is: The percentage of time that core digital platforms and websites are fully operational.
- Why it matters: Downtime equals lost revenue, damaged user trust, and dropped productivity. For enterprise or public-facing sites, this is non-negotiable.
15. Anomalous Login Attempts
- What it is: The tracking of spikes in failed logins or unexpected geographic access patterns.
- Why it matters: Monitoring this KPI allows security teams to flag and mitigate brute-force attacks or credential stuffing before they result in a data breach.
16. Mean Time to Resolution (MTTR)
- What it is: The average time it takes to fully resolve an internal IT support ticket.
- Why it matters: High MTTR directly drags down company-wide productivity. It highlights where your support team might need better tools or extra staffing.
How to Build Your KPI System
Don't copy this list wholesale. The most useful thing you can do with these examples is use them to start a conversation with your team. If you are building a framework from scratch, our Digital Business KPI Playbook is a good place to start. Sit down with your team and ask:
- Does this metric connect to a goal we actually care about?
- Can our actions directly influence it?
- Do we know exactly what we would do if this number dropped by 15% tomorrow?
If the answer to any of those is no, leave it out.
A final note on execution: Your team's ability to hit these KPIs depends heavily on the tools they use. For example, if your marketing or HR teams are tracking engagement and publishing speeds, but are fighting against a slow, rigid Content Management System (CMS), your technology is actively tanking your metrics. The platform you build on is just as important as the numbers you track.
Start small. Pick two or three examples from the categories above. Establish your baseline, define your action triggers, and review them consistently. That simple framework puts you ahead of what most teams are doing today.
See It in Action
Slow publishing cycles and tangled approval workflows will show up in your KPIs eventually. Concrete CMS is built to keep content moving with permissions, workflow, and in-context editing all built in. No plugins required.