
HR teams collect massive amounts of data: headcount, turnover, time-to-hire, engagement scores, and training completion rates. However, the core challenge isn't accessing the numbers it’s knowing which ones actually provide actionable insights.
A well-chosen HR KPI does more than describe past events; it drives future strategy. This guide breaks down practical HR KPI examples by category, highlighting what each signal means and when you need to act.
Looking for a broader framework?
- If you are building a KPI framework from the ground up, the Digital Business KPI Playbook covers the essential fundamentals.
- For examples across marketing, IT, and project management, our KPI Examples for Every Team post serves as an excellent companion read.
Table of Contents
- What Is a KPI in HR?
- The 5 Main Universal KPIs
- The 7 Pillars of HR
- The 5 Core HR Metrics to Track First
- Recruitment and Hiring KPIs
- Onboarding KPIs
- Retention and Engagement KPIs
- Intranet and Internal Comms KPIs
- Building Your HR KPI Dashboard
What Is a KPI in HR?
An HR KPI (Key Performance Indicator) is a quantifiable metric used to evaluate how effectively your HR department is achieving its core business objectives.
The critical distinction lies in predictability and intent:
- HR Metrics merely track status or look backward to tell you what happened (e.g., total number of applications received).
- HR KPIs are directly tied to strategic targets and trigger specific operational responses when they fluctuate (e.g., a sudden drop in candidate acceptance rates that requires adjusting compensation bands).
The 5 Main Universal KPIs
Across virtually every industry, high-performing businesses align their operations around five core KPI categories. HR plays a primary or supportive role in several of these:
| Category | Business focus | HR real-world impact |
|---|---|---|
| 1. Financial performance | Revenue, profit margins, budget variance | Direct management of cost-per-hire and workforce overhead. |
| 2. Customer satisfaction | Net Promoter Score (NPS), retention | High employee satisfaction directly correlates to better customer service. |
| 3. Operational efficiency | Cycle times, process completion, error rates | Streamlining internal processes like time-to-fill and compliance workflows. |
| 4. Employee engagement | Turnover, productivity, eNPS | Minimizing costly voluntary turnover and boosting cultural health. |
| 5. Growth and pipeline | Lead generation, market expansion | Securing top-tier talent pipelines to scale business operations. |
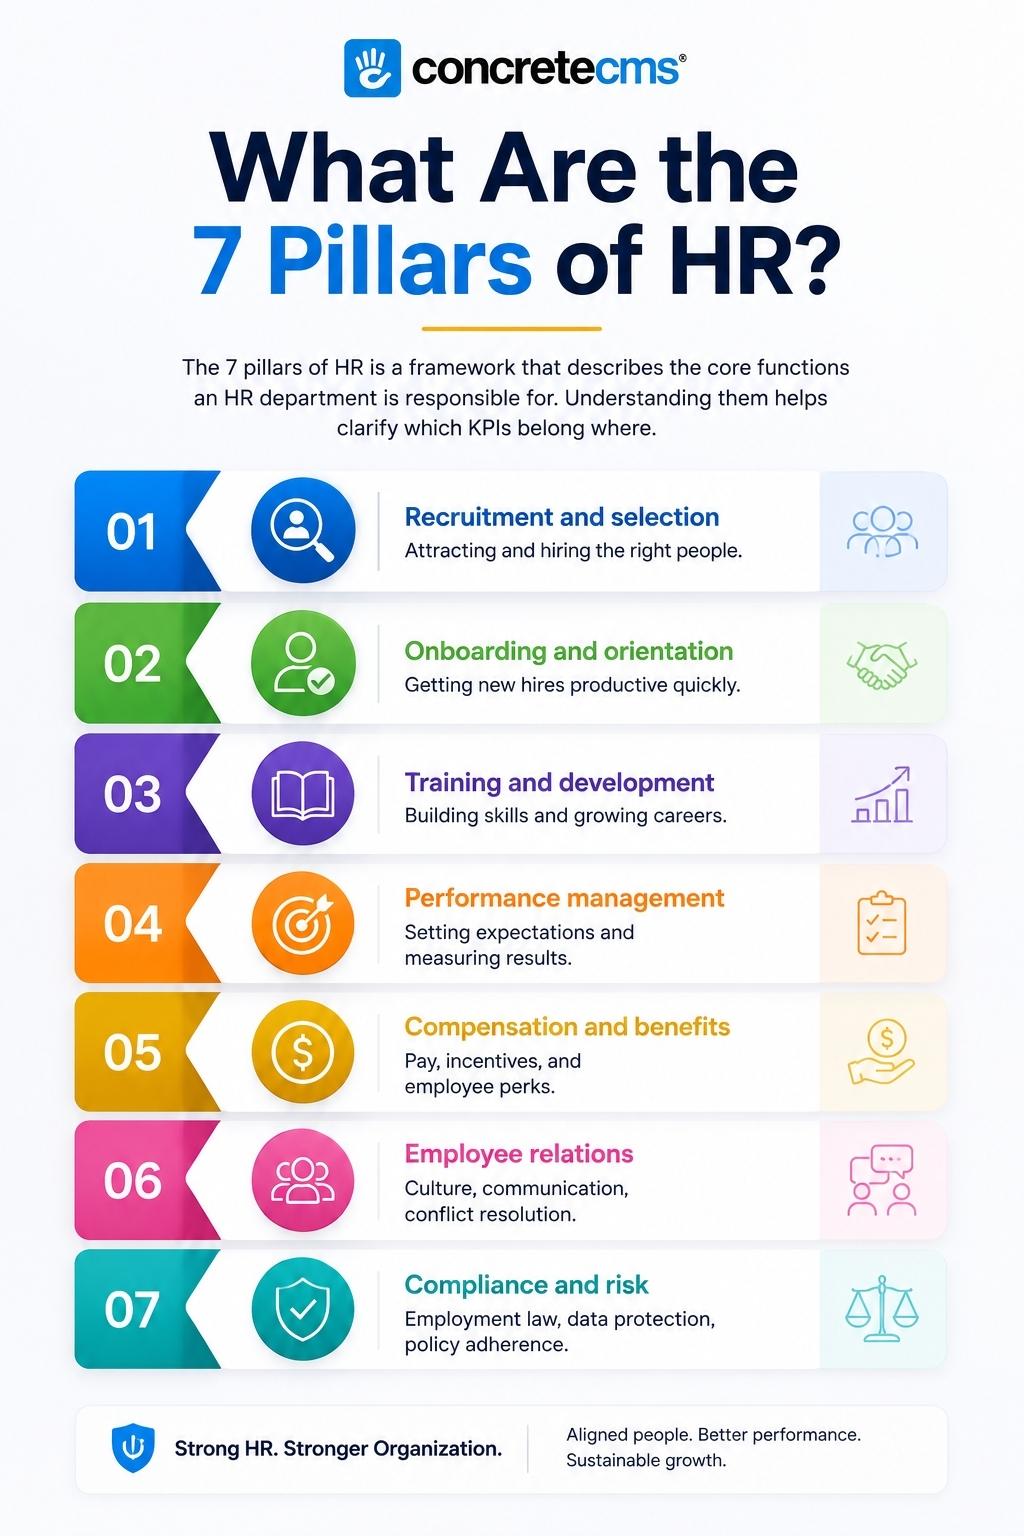
The 7 Pillars of HR
The 7 pillars framework outlines the foundational responsibilities of a comprehensive human resources function. Mapping your KPIs back to these pillars ensures balanced reporting:
- Recruitment and Selection: Attracting, vetting, and securing the right talent.
- Onboarding and Orientation: Transitioning new hires into productive team members.
- Training and Development: Upskilling employees to bridge capability gaps.
- Performance Management: Aligning individual contributions with corporate goals.
- Compensation and Benefits: Ensuring competitive, equitable pay structures.
- Employee Relations: Cultivating culture, clear communication, and conflict resolution.
- Compliance and Risk Management: Navigating employment law and corporate safety.
The 5 Core HR Metrics to Track First
If you are launching your hr analytics kpi strategy and want a lean, high-impact scorecard, prioritize these five foundational metrics:
- Time to Fill: Gauges recruitment efficiency and talent team velocity.
- Employee Turnover Rate: Serves as the ultimate litmus test for organizational retention and cultural health.
- Time to Productivity: Measures the velocity and success of your onboarding architecture.
- Employee Net Promoter Score (eNPS): Quantifies qualitative employee satisfaction over time.
- HR Self-Service Rate: Tracks how effectively employees find answers using your internal tech stack.

For organizations navigating compliance-heavy landscapes, reviewing the Fust Charles Chambers case study offers a real-world look at how structured communication helps hit critical compliance goals.
Focusing consistently on these five pillars provides a far sharper operational picture than tracking dozens of minor data points sporadically.
Recruitment and Hiring KPIs
Data-driven recruitment optimizes your talent acquisition spend and protects your team from productivity bottlenecks.
Time to Fill
- Definition: The average number of calendar days between a job requisition opening and an offer being formally accepted.
- Strategic Value: Prolonged vacancies stunt team outputs and increase burnout among existing staff. Tracking this over time reveals structural bottlenecks within your interview pipelines.
Quality of Hire
- Definition: A composite metric scoring performance ratings, operational ramp time, and 12-month retention rates of new hires.
- Strategic Value: While Time to Fill measures speed, Quality of Hire measures long-term value. It ensures your recruiting processes are attracting lasting contributors.
Offer Acceptance Rate
- Definition: The percentage of extended formal offers accepted by candidates.
- Strategic Value: A dipping acceptance rate acts as an early warning system indicating that your compensation packages, market reputation, or interview experiences are losing competitive ground.
Source of Hire
- Definition: The exact channels (internal referrals, job boards, LinkedIn, agency partners) generating your successful placements.
- Strategic Value: This serves as the marketing equivalent of "conversion rate by channel." If employee referrals routinely deliver high-performing hires at lower costs, you can confidently reallocate budget away from expensive job boards.
Try it free
See what Concrete CMS can do for your team
No setup headaches. No commitment. Just the real platform.
Onboarding KPIs
Onboarding sets the tone for an employee’s entire tenure. Strong hr manager kpi examples in this category balance operational speed with employee clarity.
Time to Productivity
- Definition: The duration of time required for a new employee to reach an acceptable, independent standard of work.
- Strategic Value: Keeps tabs on whether your onboarding paths are genuinely empowering new team members or just acting as a box-checking exercise.
Onboarding Task Completion Rate
- Definition: The percentage of required orientation modules and compliance items finalized within deadlines.
- Strategic Value: Consistent drops in completion rates indicate confusing navigation or poor UX within your company platform. If you're auditing whether your infrastructure supports this, read up on the benefits of investing in internal HR systems.
90-Day Retention Rate
- Definition: The percentage of new hires remaining with the company at the 90-day milestone.
- Strategic Value: Early attrition is incredibly expensive and represents misaligned expectations during the hiring phase or a failure during onboarding immersion.
Retention and Engagement KPIs
Retention metrics hold substantial financial implications. Replacing an employee frequently costs anywhere from 50% to 200% of their base salary when accounting for sourcing costs and lost output.
Employee Turnover Rate
- Definition: The overall percentage of employees who leave the business (both voluntarily and involuntarily) within a specified timeframe.
- Strategic Value: The baseline indicator of organizational stability. Break this data down by department and tenure to uncover hidden management or cultural problems.
Voluntary Turnover Rate
- Definition: The percentage of departures originating from employee-led resignations.
- Strategic Value: This is your most actionable retention metric. High voluntary turnover indicates structural friction points surrounding career pathing, compensation, or company culture.
Employee Net Promoter Score (eNPS)
- Definition: A core indicator derived from a single question: "On a scale of 0-10, how likely are you to recommend this company as a great place to work?"
- Strategic Value: Highly predictive and simple to deploy. Sudden drops in eNPS act as a leading indicator, shifting down long before actual resignations start to climb.
Absenteeism Rate
- Definition: The percentage of scheduled operational hours lost to unplanned, chronic absences.
- Strategic Value: Elevated absenteeism levels frequently point toward deeper workplace issues like systemic burnout, poor management behavior, or low workplace morale.
Intranet and Internal Communications KPIs
In hybrid and distributed work environments, internal communication platforms are the bedrock of operational clarity. Failing to measure engagement here can result in hidden operational drag.
HR Self-Service Rate
- Definition: The percentage of standard HR questions resolved via the company intranet relative to manual incoming tickets (emails, Slack/Teams messages, calls).
- Strategic Value: A high self-service rate frees your HR department to focus on high-impact strategic initiatives rather than basic administrative support.
Key Resource Adoption Rate
- Definition: Unique views, read confirmations, and download metrics tied to crucial corporate files (e.g., benefits packages, updated employee handbooks).
- Strategic Value: Simply uploading a critical update doesn’t equal engagement. If an open enrollment guide sees only an 8% view rate over three weeks, your communication pathways need adjustment.
Intranet Employee Satisfaction
- Definition: Pulse check survey data evaluating whether employees can find information quickly within your internal systems.
- Strategic Value: Traditional web traffic statistics show where employees go; satisfaction metrics reveal if the content actually helped them. For a granular look at optimization, read our full breakdown on intranet adoption and engagement metrics.
Building Your HR KPI Dashboard
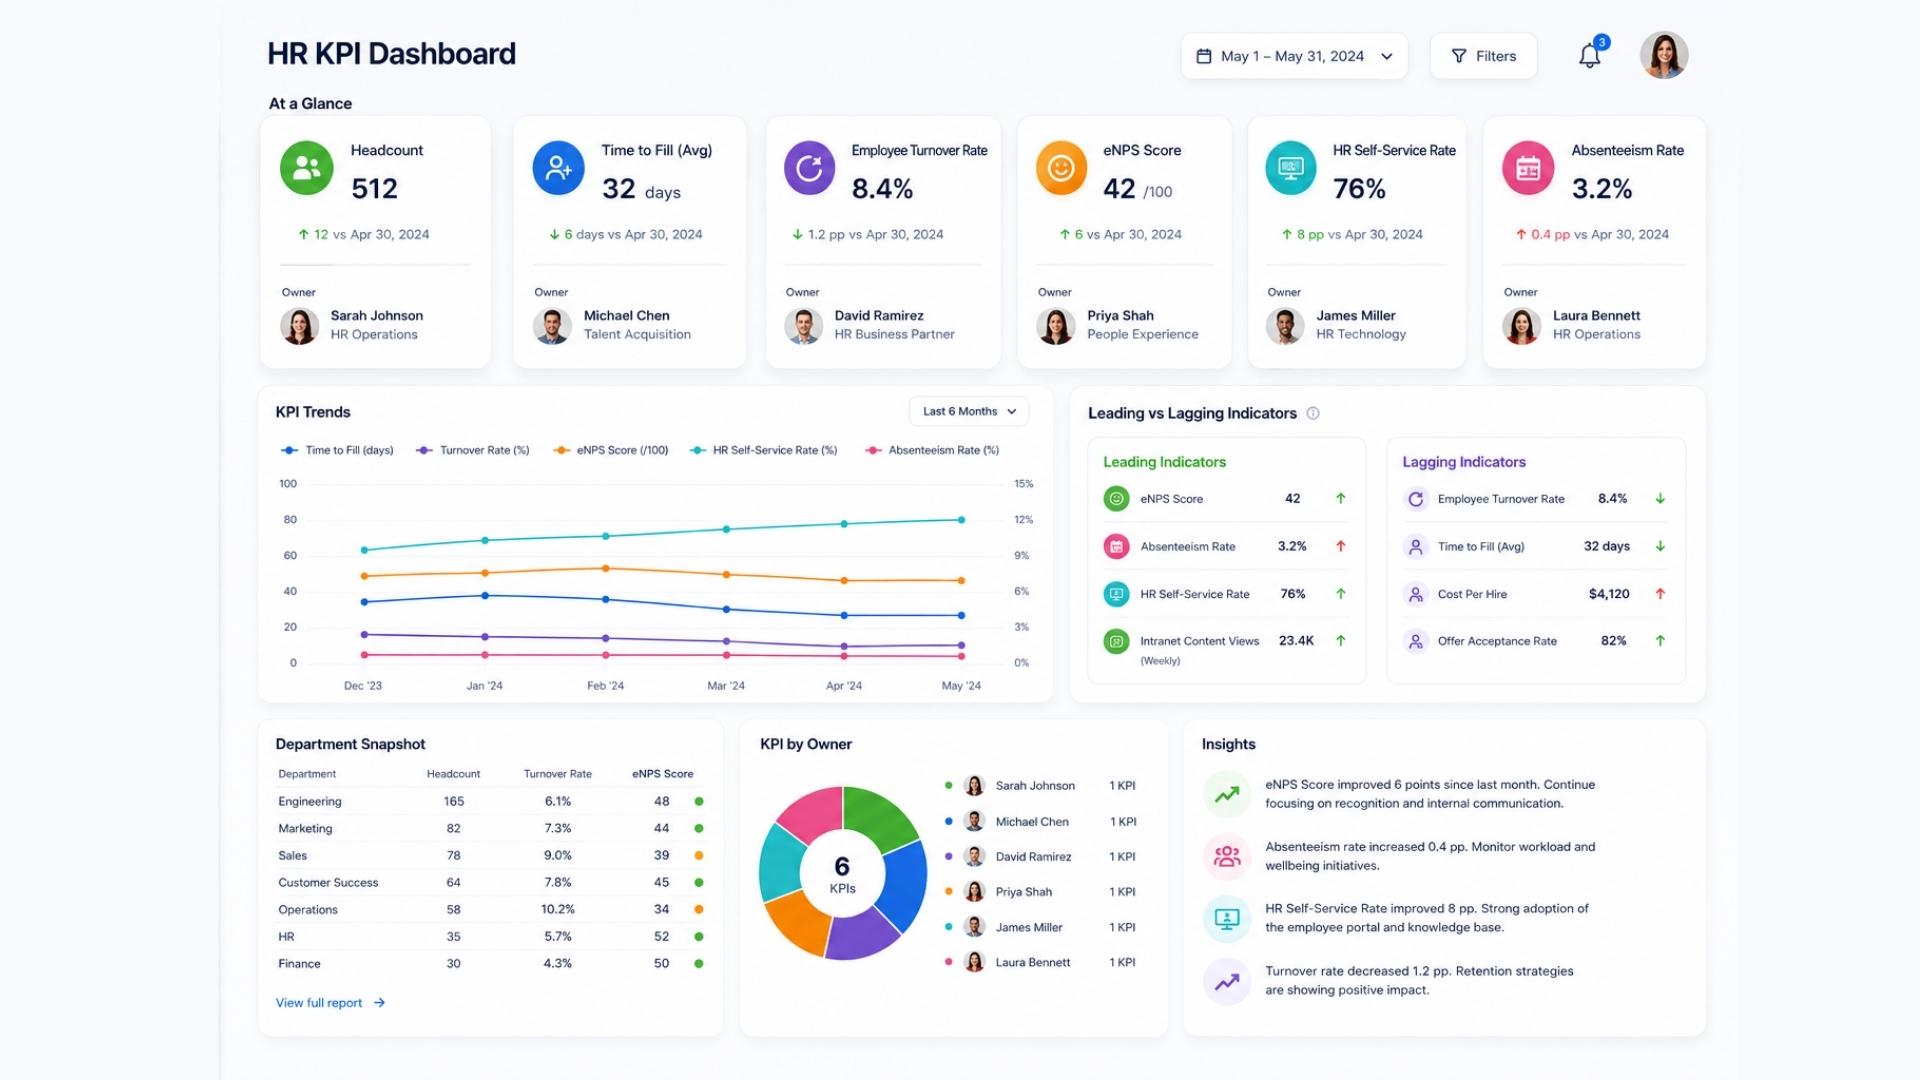
An effective hr kpi dashboard drives strategic action it shouldn't just be an unread data dump.
To build a dashboard that leadership will value, follow these four guiding principles:
- Balance Leading and Lagging Indicators: Turnover metrics are lagging indicators (they show what has already happened). eNPS and absenteeism are leading indicators (they predict what is coming next). A robust dashboard balances both.
- Keep It Capped (6 to 8 KPIs): Do not overcomplicate your main dashboard view. Too many visual cues dilute the data that truly matters. Keep the exhaustive reports separate from the primary executive dashboard.
- Assign Clear Owners: A KPI without an assigned owner is just an unmanaged metric. Every data stream on your dashboard needs a clear point-person responsible for responding if numbers drift off-target.
- Maintain Regular Cadences: Review the data monthly to capture trends effectively. For fluid events—such as a major software transition or policy rollout—shift to a weekly review cycle to stay agile.
The Technical Variable
Your content infrastructure heavily influences these operational numbers. If rolling out an internal announcement requires days of development work due to a clunky CMS, or if employees struggle to locate policy documents because of poor search tools, your self-service rates and engagement metrics will suffer. The software behind your portal matters.
See It in Action
Concrete CMS gives your HR team the autonomy to safely publish updates, configure custom user permissions, and optimize intranet resource hubs without constantly waiting on IT queues. Built-in governance workflows mean security and editing control come standard.
Try it free
See what Concrete CMS can do for your team
No setup headaches. No commitment. Just the real platform.